
The highest average income, according to the statistics, is £52,200, while the lowest is £37,800.
The ONS breaks Harrogate down into 21 neighbourhoods called Middle-layer Super Output Areas.
The average income statistics are the latest available by neighbourhood, published by the Office for National Statistics in March 2020 and relating to the financial year ending 2018.
Total annual household income is the sum of the before-tax income of every member of the household, plus any income from benefits.
The estimates were calculated by the ONS using various sources of information, including the 2011 Census and the annual Family Resources Survey.
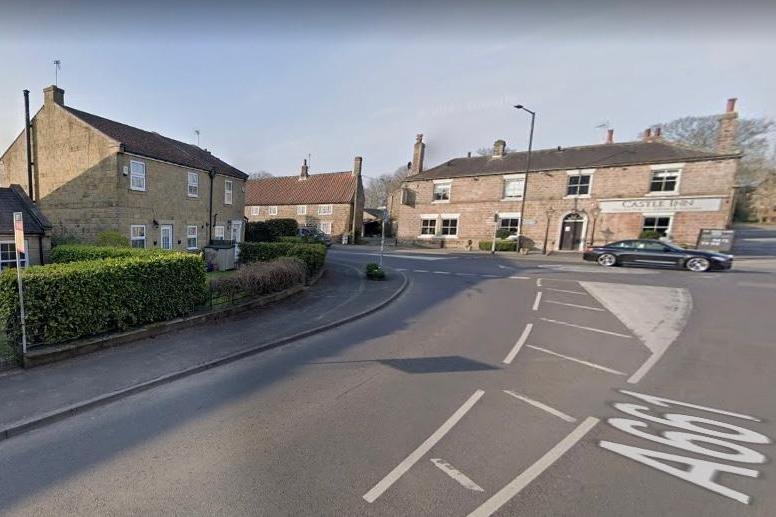
1. Spoffoth, Burn Bridge and Huby
The average annual household income for Spoffoth, Burn Bridge and Huby is £52,200 - the highest of all Harrogate neighbourhoods according to the latest Office for National Statistics figures published in March 2020 Photo: Google Maps
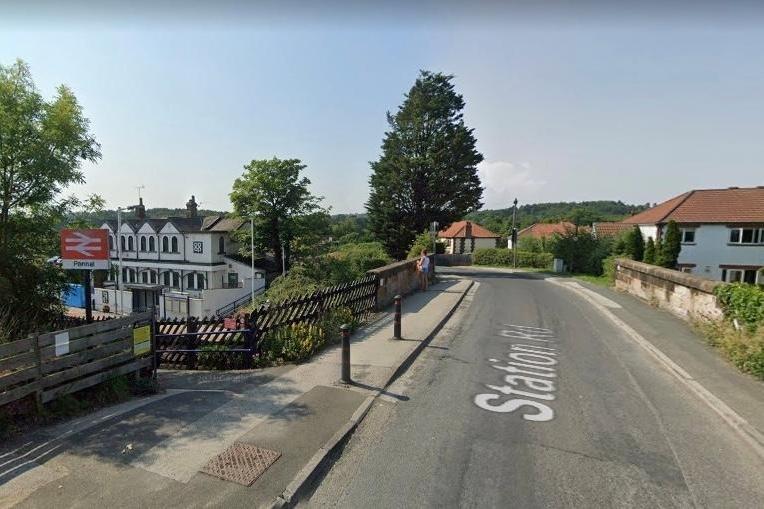
2. Harrogate West and Pannal Ash
The average annual household income for Harrogate West and Pannal Ash is £51,900 - the second highest of all Harrogate neighbourhoods according to the latest Office for National Statistics figures published in March 2020 Photo: Google Maps
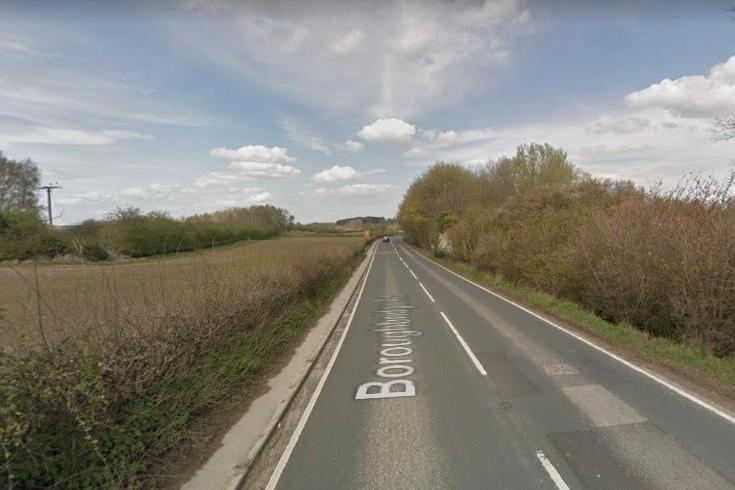
3. Knaresborough North
The average annual household income for Knaresborough North is £51,600 - the third highest of all Harrogate neighbourhoods according to the latest Office for National Statistics figures published in March 2020 Photo: Google Maps
4. Stray
The average annual household income for Stray is £50,800 - the fourth highest of all Harrogate neighbourhoods according to the latest Office for National Statistics figures published in March 2020 Photo: Google Maps