
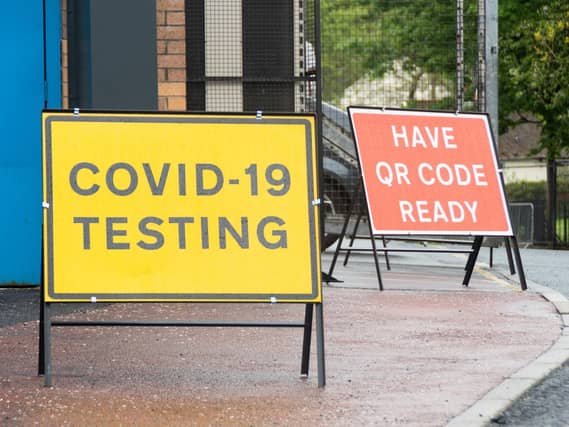
However, the number is still lower than the national average, which sits at 93 per 100,000 people.
These are the latest Covid-19 figures for every area of Harrogate. Areas where two of fewer cases were confirmed in the seven days up to Tuesday, June 15, may not be included in the data.
Please note: Data is provided for each of the district's Middle layer Super Output Areas (MSOAs), which may not always tally with local authority wards.
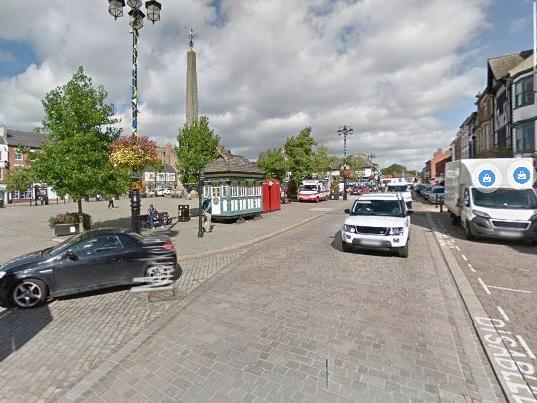
9. Ripon North and West
There have been 9 new cases of Covid-19 recorded in Ripon North and West in the week leading up to June 15. It has a rolling rate of 146.3 per 100,000 people. This is up 350% from the previous week. Photo: Google Maps
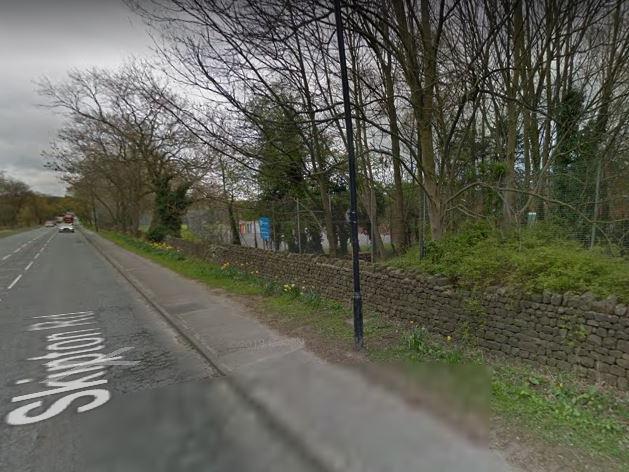
10. Saltergate
There have been 6 new cases of Covid-19 recorded in Saltergate in the week leading up to June 15. It has a rolling rate of 80.1 per 100,000 people. This is up 200% from the previous week. Photo: Google Maps
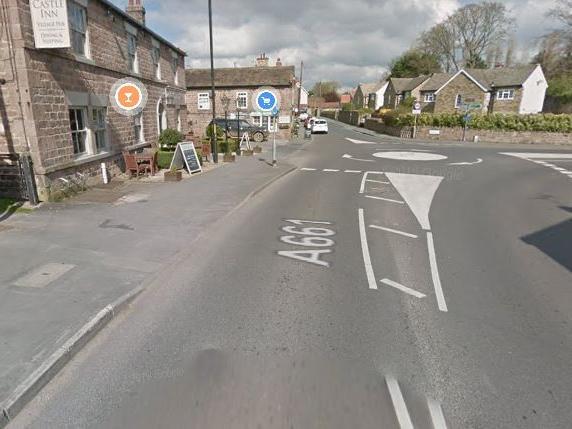
11. Spofforth, Burn Bridge and Huby
There have been 6 new cases of Covid-19 recorded in Spofforth, Burn Bridge and Huby in the week leading up to June 15. It has a rolling rate of 101.7 per 100,000 people. This is up 100% from the previous week. Photo: Google Maps
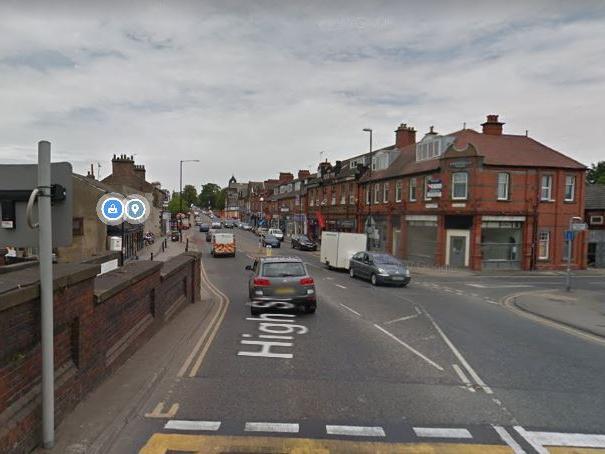
12. Starbeck
There have been 6 new cases of Covid-19 recorded in Starbeck in the week leading up to June 15. It has a rolling rate of 64.6 per 100,000 people. This is up 20% from the previous week. Photo: Google Maps