

But despite that, average house prices held up across England – even if there was a drop in sales.
It was the same picture in Harrogate, however, where prices rose by 7.4% in the year to September 2020. Across Yorkshire and the Humber, prices rose by 3.2%.
The ONS also publishes house price figures by Middle Layer Super Output Areas (MSOAs) – small geographic areas containing an average of 7,200 people.
These show 13 of the 21 MSOAs that make up Harrogate saw a rise in house prices over the same period.
Here we reveal which neighbourhoods saw the strongest growth in the year to September 2020.
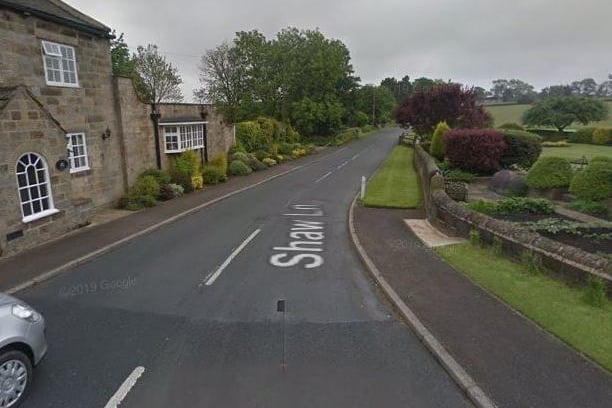
1. Menwith, Beckwithshaw and Denton Moor
The biggest price hike was in Menwith, Beckwithshaw and Denton Moor where the average price rose to £543,789 up by 20.8% on the year to September 2019. Overall, 59 houses changed hands here between October 2019 and September 2020, a drop of 29% on the year before. Photo: Google Maps
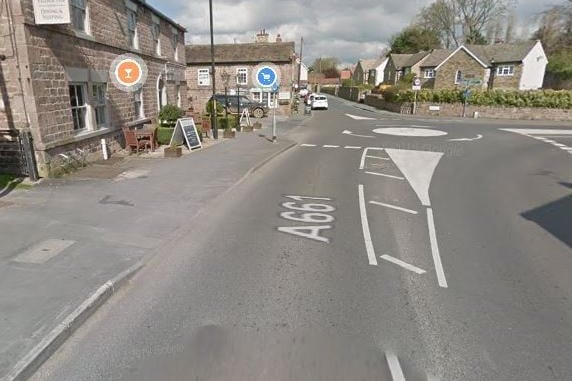
2. Spofforth, Burn Bridge and Huby
The second biggest price hike was in Spofforth, Burn Bridge and Huby where the average price rose to £554,849, up by 17.8% on the year to September 2019. Overall, 76 houses changed hands here between October 2019 and September 2020, a drop of 7% on the year before. Photo: Google Maps
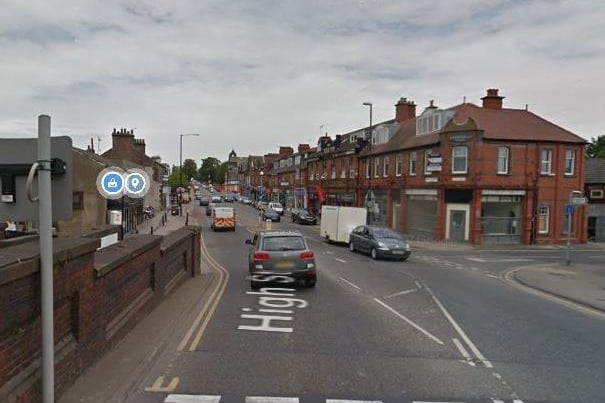
3. Starbeck
The third biggest price hike was in Starbeck where the average price rose to £261,577, up by 17.2% on the year to September 2019. Overall, 127 houses changed hands here between October 2019 and September 2020, a drop of 30% on the year before. Photo: Google Maps
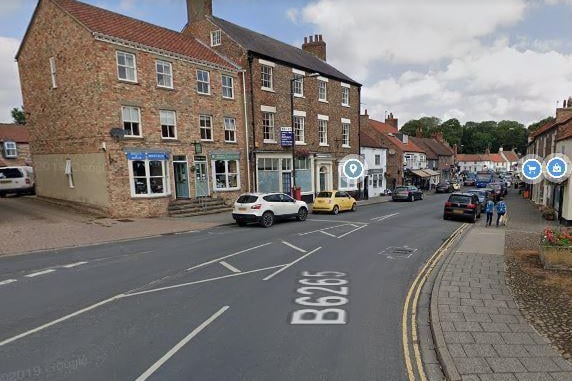
4. Boroughbridge and Marton-cum-Grafton
The fourth biggest price hike was in Boroughbridge and Marton-cum-Grafton where the average price rose to £384,546, up by 16.2% on the year to September 2019. Overall, 136 houses changed hands here between October 2019 and September 2020, a drop of 4% on the year before. Photo: Google Maps